A backtest is a simulation of how a rule would have performed in the past. It is the best tool we have for testing an idea before risking money, and the easiest way to lie to yourself with a chart.
This tutorial closes the measurement part of our series, after Sharpe, Sortino and Omega and the Kelly criterion. A backtest feeds both: if the backtest is wrong, every ratio and every position size built on it is wrong too.
Quick check. You test 100 random trading rules that have no edge at all, on 5 years of data. What Sharpe ratio does the best one show?
Close to zero? The answer is below, and it is the most important number in this article.
Trap 1: overfitting (testing too many ideas)
Every variation you try (a different moving average, another threshold, one more filter) is a new lottery ticket. Keep the best one and you have selected luck.
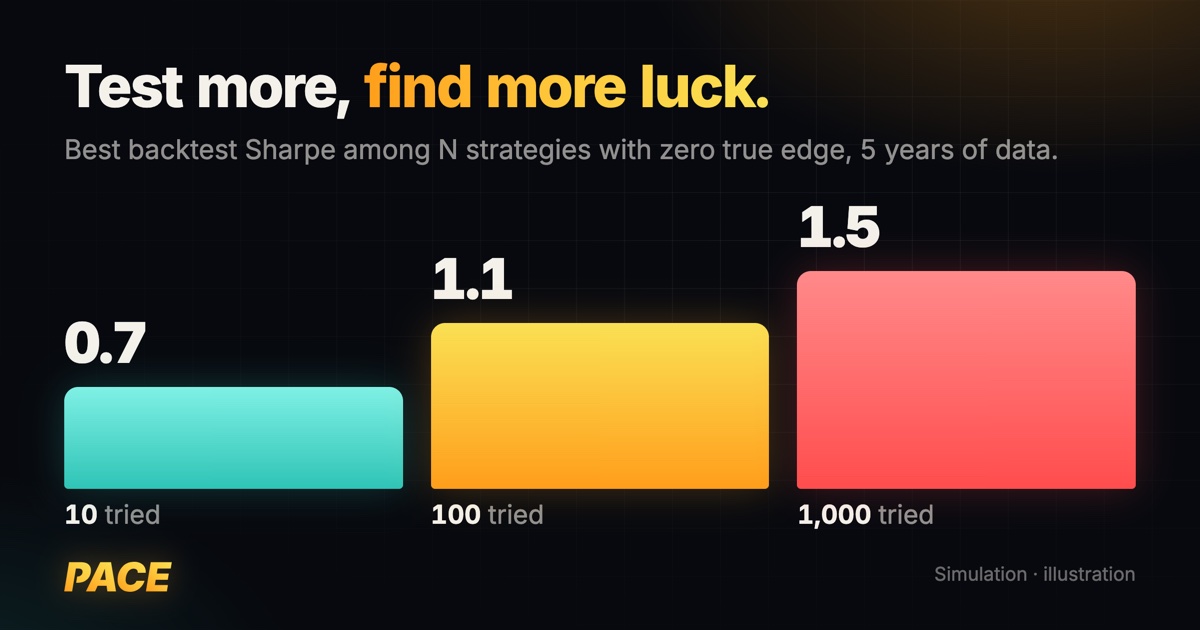
A simple simulation: strategies with zero true edge, 5 years of data each.
| Strategies tested | Typical best Sharpe ratio, by luck alone |
|---|---|
| 10 | ≈ 0.7 |
| 100 | ≈ 1.1 |
| 1,000 | ≈ 1.5 |
Mathematicians David Bailey, Jonathan Borwein, Marcos López de Prado and Qiji Jim Zhu called this "pseudo-mathematics and financial charlatanism". With a short history, a modest number of trials is enough to manufacture an impressive backtest from noise. Bailey and López de Prado's deflated Sharpe ratio adjusts the result for how many things you tried.
Trap 2: the research itself is overfitted
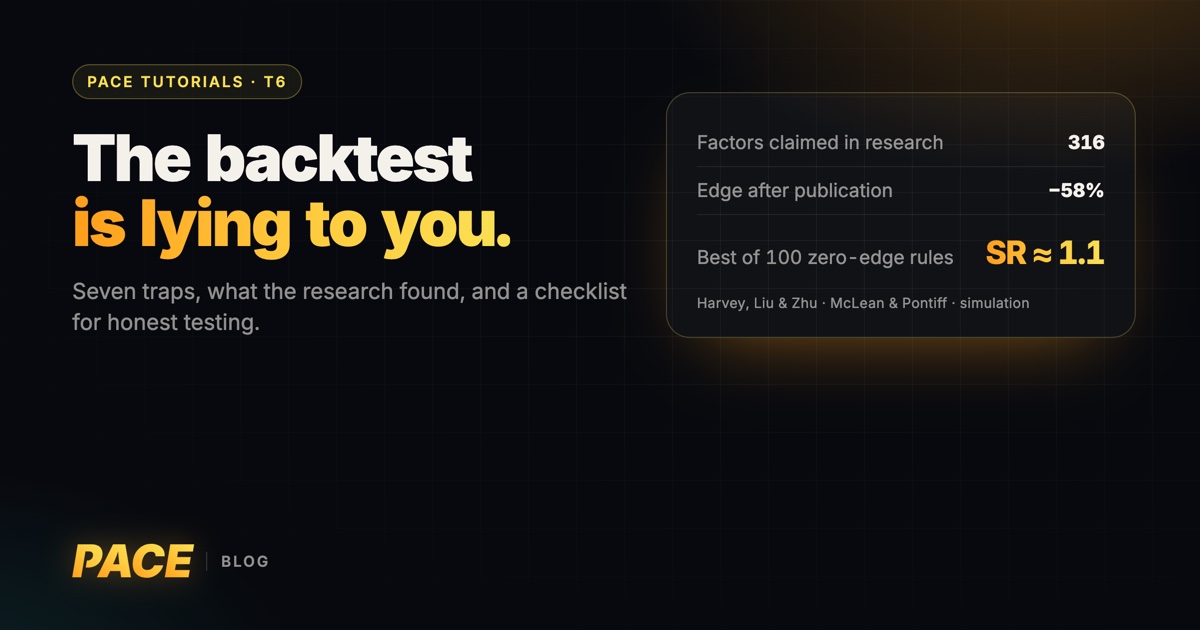
The problem isn't only for amateurs. Campbell Harvey, Yan Liu and Heqing Zhu counted 316 factors that academics have claimed predict stock returns. Given how many have been tested, they argue a new factor should clear a t-statistic of about 3.0, not the usual 2.0.
David McLean and Jeffrey Pontiff studied 97 published predictors. Returns were about 26% lower out of sample and about 58% lower after publication. Part of an edge is chance, and part disappears once everyone knows about it.
Trap 3: look-ahead bias
Using information you would not have had at the time. Examples: buying at a day's close using a signal computed from that same close, or using company earnings on the period end date when they were only published weeks later. The fix is to ask, for every input: when exactly was this known?
Trap 4: survivorship bias
Testing on today's index members ignores the companies that went bankrupt or were delisted along the way. Your backtest only "owns" the winners. Use datasets that include dead companies.
Trap 5: ignoring costs and slippage
Commissions, spreads, slippage, taxes and funding costs. A strategy that trades often can turn from great to useless once realistic costs are in. Even TradingView's documentation on strategy testing warns that results depend on these simulation assumptions.
Trap 6: one regime, one story
A strategy tested only in a long bull market has never met a bear. Test across rising and falling markets, high and low rates, calm and crisis periods.
Trap 7: treating forward results as the final verdict
Splitting data into in-sample (to build) and out-of-sample (to test) is essential. But a weaker forward result is not automatically "proof of overfitting", and a better one is not automatically "noise". Market regime, sample size and costs all play a part. Judge forward results with the same statistics you used on the backtest.
The principle
Every extra idea you test is a cost. Write the rule down before you test it, count how many variations you tried, keep data the rule has never seen, include realistic costs, and expect live results to be worse.
Your honest-backtest checklist
- Write the hypothesis and the exact rule before looking at results.
- Log every variation you test, not just the winner.
- Keep at least 30% of the history untouched until the very end.
- Check every input for look-ahead: when was it actually available?
- Use data that includes delisted and bankrupt securities.
- Add realistic costs, spreads and slippage, then double them.
- Test across different market regimes.
Answer to the quick check
About 1.1. Among 100 rules with no edge on 5 years of data, the best one typically shows a Sharpe ratio above 1, which would look excellent on a slide.
Sources
- Bailey, D. H., Borwein, J. M., López de Prado, M. & Zhu, Q. J. (2014). Pseudo-Mathematics and Financial Charlatanism: The Effects of Backtest Overfitting on Out-of-Sample Performance. Notices of the AMS, 61(5), 458–471. Link
- Bailey, D. H. & López de Prado, M. (2014). The Deflated Sharpe Ratio. Journal of Portfolio Management, 40(5), 94–107. Link
- Harvey, C. R., Liu, Y. & Zhu, H. (2016). …and the Cross-Section of Expected Returns. Review of Financial Studies, 29(1), 5–68. Link
- McLean, R. D. & Pontiff, J. (2016). Does Academic Research Destroy Stock Return Predictability? Journal of Finance, 71(1), 5–32. Link
- TradingView. Pine Script documentation: Strategies. Link
Educational content, not financial advice. The simulation is illustrative. Past or simulated performance does not guarantee future results.